5.3 線のフォーマットの変更
線のフォーマットを変更する方法を説明します。
1. サンプルコード
線のフォーマットを変更する ChangeLineFormat.html 及び ChangeLineFormat.js のサンプルコードです。 このサンプルコードでは、ユーザインタフェースを介して、皇居、東京タワー間を結ぶ線のフォーマットを変更します。変更できるフォーマットは、線の幅、線の色です。線の幅は、1、3、7、13、17、21に変更でき、線の色は、カラーピッカーで変更できます。
1.1. ChangeLineFormat.html
 1: <!DOCTYPE html>
 2: <html>
 3:     <head>
 4:         <meta charset="utf-8">
 5:         <title>ChangeLineFormatSample</title>
 6:         <script src="https://resource.mapray.com/mapray-js/v0.9.5/mapray.min.js"></script>
 7:         <link rel="stylesheet" href="https://resource.mapray.com/styles/v1/mapray.css">
 8:         <script src="ChangeLineFormat.js" charset="utf-8"></script>
 9:         <style>
10:             html, body {
11:                 height: 100%;
12:                 margin: 0;
13:                 background-color: #E0E0E0;
14:             }
15:
16:             select{
17:                 height:22px;
18:                 vertical-align:middle;
19:                 font-size:13px;
20:                 margin-left:10px;
21:             }
22:
23:             p{
24:                 font-size:13px;
25:                 margin-left:5px;
26:             }
27:
28:             input{
29:                 margin-left:10px;
30:             }
31:
32:             div#mapray-container {
33:                 display: flex;
34:                 position: relative;
35:                 height: calc(100% - 34px);
36:             }
37:
38:             div#LineWidthBox {
39:                 display: flex;
40:                 background-color: #E0E0E0;
41:                 height: 32px;
42:                 width: 135px;
43:                 float: left;
44:                 border: inset 1px #000000;
45:                 align-items: center;
46:             }
47:
48:             div#LineColorBox {
49:                 display: flex;
50:                 background-color: #E0E0E0;
51:                 height: 32px;
52:                 width: 145px;
53:                 float: left;
54:                 border: inset 1px #000000;
55:                 align-items: center;
56:             }
57:         </style>
58:     </head>
59:
60:     <body onload="CreateChangeLineFormatInstance('mapray-container');">
61:         <div id="mapray-container"></div>
62:
63:         <div id="LineWidthBox">
64:             <p>Line Width</p>
65:             <select name="LineWidthPullDown" id="LineWidthPullDown" onchange="LineWidthValueChanged()">
66:                 <option value=1>1</option>
67:                 <option value=3>3</option>
68:                 <option value=7>7</option>
69:                 <option value=13>13</option>
70:                 <option value=17>17</option>
71:                 <option value=21>21</option>
72:             </select>
73:         </div>
74:
75:         <div id="LineColorBox">
76:             <p>Line Color</p>
77:             <input type="color" id="LineColorPallet" name="LineColorPallet" value="#ffffff" onchange="LineColorValueChanged()">
78:         </div>
79:     </body>
80: </html>
1.2. ChangeLineFormat.js
  1: var change_Line_Format;
  2:
  3: class ChangeLineFormat {
  4:
  5:     constructor(container) {
  6:         // Access Tokenを設定
  7:         var accessToken = "<your access token here>";
  8:
  9:         // Viewerを作成する
 10:         this.viewer = new mapray.Viewer(
 11:             container, {
 12:                 image_provider: this.createImageProvider(),
 13:                 dem_provider: new mapray.CloudDemProvider(accessToken)
 14:             }
 15:         );
 16:
 17:         this.SetCamera();
 18:
 19:         this.MakeUIFormatLine();
 20:
 21:         this.SetLinePointStr();
 22:     }
 23:
 24:     // 画像プロバイダを生成
 25:     createImageProvider() {
 26:         // 国土地理院提供の汎用的な地図タイルを設定
 27:         return new mapray.StandardImageProvider( { url: "https://cyberjapandata.gsi.go.jp/xyz/seamlessphoto/", format: "jpg", min_level: 2, max_level: 18 } );
 28:     }
 29:
 30:     SetCamera() {
 31:         // カメラ位置の設定
 32:
 33:         // 球面座標系(経度、緯度、高度)で視点を設定。皇居と東京タワーの中間点付近
 34:         var home_pos = { longitude: 139.749486, latitude: 35.671190, height: 50 };
 35:
 36:         // 球面座標から地心直交座標へ変換
 37:         var home_view_geoPoint = new mapray.GeoPoint( home_pos.longitude, home_pos.latitude, home_pos.height );
 38:         var home_view_to_gocs = home_view_geoPoint.getMlocsToGocsMatrix( mapray.GeoMath.createMatrix() );
 39:
 40:         // 視線方向を定義
 41:         var cam_pos = mapray.GeoMath.createVector3([0, 0, 7500]);
 42:         var cam_end_pos = mapray.GeoMath.createVector3([0, 0, 0]);
 43:         var cam_up = mapray.GeoMath.createVector3([0, 1, 0]);
 44:
 45:         // ビュー変換行列を作成
 46:         var view_to_home = mapray.GeoMath.createMatrix();
 47:         mapray.GeoMath.lookat_matrix(cam_pos, cam_end_pos, cam_up, view_to_home);
 48:
 49:         // カメラの位置と視線方向からカメラの姿勢を変更
 50:         var view_to_gocs = this.viewer.camera.view_to_gocs;
 51:         mapray.GeoMath.mul_AA(home_view_to_gocs, view_to_home, view_to_gocs);
 52:
 53:         // カメラのnear、farの設定
 54:         this.viewer.camera.near = 30;
 55:         this.viewer.camera.far = 500000;
 56:     }
 57:
 58:     MakeUIFormatLine() {
 59:         // 直線のエンティティを作成
 60:         var entity = new mapray.MarkerLineEntity(this.viewer.scene);
 61:
 62:         // 皇居の座標を設定
 63:         var line_fast_position = { longitude: 139.7528, latitude: 35.685175, height: 350 };
 64:
 65:         // 東京タワーの座標を設定
 66:         var line_second_position = { longitude: 139.745433, latitude: 35.658581, height: 350 };
 67:
 68:         // 各座標を配列に保存して、直線を追加
 69:         var position_array = [line_fast_position.longitude, line_fast_position.latitude, line_fast_position.height,
 70:                               line_second_position.longitude, line_second_position.latitude, line_second_position.height];
 71:         entity.addPoints(position_array);
 72:
 73:         // プルダウンの値取得
 74:         var line_Width_Value = parseFloat(document.getElementById("LineWidthPullDown").value);
 75:         var line_ColorChord = document.getElementById("LineColorPallet").value;
 76:
 77:         // ColorChordをRBGに変換
 78:         var RGBArray = this.convertColorChordToRGB(line_ColorChord);
 79:
 80:         // プルダウンの値を設定
 81:         entity.setLineWidth(line_Width_Value);
 82:         entity.setColor(RGBArray);
 83:
 84:         // エンティティをシーンに追加
 85:         this.viewer.scene.addEntity(entity);
 86:     }
 87:
 88:     SetLinePointStr() {
 89:         // 文字のエンティティを作成
 90:         var entity = new mapray.TextEntity(this.viewer.scene);
 91:
 92:         // 皇居より400mほど東の場所を設定
 93:         var fast_font_position = { longitude: 139.758503, latitude: 35.685030, height: 350 };
 94:
 95:         // GeoPointクラスを生成して、テキストを追加
 96:         var fast_font_geopoint = new mapray.GeoPoint(fast_font_position.longitude, fast_font_position.latitude, fast_font_position.height);
 97:         entity.addText( "The Imperial Palace", fast_font_geopoint, { color: [1, 1, 0], font_size: 25 } );
 98:
 99:         // 東京タワーより300mほど東の場所を設定
100:         var second_font_position = { longitude: 139.749169, latitude: 35.658252, height: 350 };
101:
102:         // GeoPointクラスを生成して、テキストを追加
103:         var second_font_geopoint = new mapray.GeoPoint(second_font_position.longitude, second_font_position.latitude, second_font_position.height);
104:         entity.addText( "Tokyo Tower", second_font_geopoint, { color: [1, 1, 0], font_size: 25 } );
105:
106:         // エンティティをシーンに追加
107:         this.viewer.scene.addEntity(entity);
108:     }
109:
110:     ChangeLineWidth() {
111:         // プルダウンの値取得
112:         var line_Width_Value = parseFloat(document.getElementById("LineWidthPullDown").value);
113:
114:         // プルダウンの値を設定
115:         var lineEntity = this.viewer.scene.getEntity(0);
116:         lineEntity.setLineWidth(line_Width_Value);
117:     }
118:
119:     ChangeLineColor() {
120:         // プルダウンの値取得
121:         var line_ColorChord = document.getElementById("LineColorPallet").value;
122:
123:         // ColorChordをRBGに変換
124:         var RGBArray = this.convertColorChordToRGB(line_ColorChord);
125:
126:         // プルダウンの値を設定
127:         var lineEntity = this.viewer.scene.getEntity(0);
128:         lineEntity.setColor(RGBArray);
129:     }
130:
131:     convertColorChordToRGB(colorChord) {
132:         var colorChordChars = colorChord.split('');
133:
134:         var r = parseInt(colorChordChars[1].toString() + colorChordChars[2].toString(), 16) / 255;
135:         var g = parseInt(colorChordChars[3].toString() + colorChordChars[4].toString(), 16) / 255;
136:         var b = parseInt(colorChordChars[5].toString() + colorChordChars[6].toString(), 16) / 255;
137:
138:         return [r, g, b];
139:     }
140:
141: }
142:
143: function CreateChangeLineFormatInstance(container) {
144:     change_Line_Format = new ChangeLineFormat(container);
145: }
146:
147: function LineWidthValueChanged() {
148:     change_Line_Format.ChangeLineWidth();
149: }
150:
151: function LineColorValueChanged() {
152:     change_Line_Format.ChangeLineColor();
153: }
2. htmlのサンプルコードの詳細
htmlのサンプルコードの詳細を以下で解説します。
2.1. htmlの文字コード設定
4行目でhtmlの文字コードを設定します。このサンプルコードでは、utf-8を設定します。
4: <meta charset="utf-8">
2.2. タイトルの設定
5行目でタイトルの設定をします。このサンプルコードでは、ChangeLineFormatSampleを設定します。
5: <title>ChangeLineFormatSample</title>
2.3. JavaScriptファイルのパス設定
6~8行目で参照するJavaScript及びスタイルシートのパスを設定します。このサンプルコードでは、maprayのJavaScriptファイル、スタイルシート、線のフォーマットを変えるJavaScriptファイル( ChangeLineFormat.js )を設定します。線のフォーマットを変えるJavaScriptファイルの文字コードはutf-8に設定します。
6: <script src="https://resource.mapray.com/mapray-js/v0.9.5/mapray.min.js"></script>
7: <link rel="stylesheet" href="https://resource.mapray.com/styles/v1/mapray.css">
8: <script src="ChangeLineFormat.js" charset="utf-8"></script>
2.4. スタイルの設定
8~56行目で表示する要素のスタイルを設定します。このサンプルコードでは、下記のスタイルを設定します。
- html
- body
- select
- p
- input
- div#mapray-container(地図表示部分)
- div#LineWidthBox(線幅変更コンボボックス表示部分)
- div#LineColorBox(線色変更ボタン表示部分)
 8: <style>
 9:     html, body {
10:         height: 100%;
11:         margin: 0;
12:         background-color: #E0E0E0;
13:     }
14:
15:     select{
16:         height:22px;
17:         vertical-align:middle;
18:         font-size:13px;
19:         margin-left:10px;
20:     }
21:
22:     p{
23:         font-size:13px;
24:         margin-left:5px;
25:     }
26:
27:     input{
28:         margin-left:10px;
29:     }
30:
31:     div#mapray-container {
32:         display: flex;
33:         position: relative;
34:         height: calc(100% - 34px);
35:     }
36:
37:     div#LineWidthBox {
38:         display: flex;
39:         background-color: #E0E0E0;
40:         height: 32px;
41:         width: 135px;
42:         float: left;
43:         border: inset 1px #000000;
44:         align-items: center;
45:     }
46:
47:     div#LineColorBox {
48:         display: flex;
49:         background-color: #E0E0E0;
50:         height: 32px;
51:         width: 145px;
52:         float: left;
53:         border: inset 1px #000000;
54:         align-items: center;
55:     }
56: </style>
2.5. loadイベントの設定
画面を表示するときに、線フォーマット変更クラスを生成します。そのため、60行目でページ読み込み時に、線のフォーマットを変更するクラスのインスタンスを生成する関数( CreateChangeLineFormatInstance )を呼ぶように設定します。 線のフォーマットを変更するクラスのインスタンスを生成する関数は、JavaScriptのサンプルコードの詳細で説明します。
60: <body onload="CreateChangeLineFormatInstance('mapray-container');">
2.6. 地図表示部分の指定
61行目で地図表示部分のブロックを記述します。 詳細はヘルプページ『緯度経度によるカメラ位置の指定』を参照してください。
61: <div id="mapray-container"></div>
2.7. 線の幅変更のUI
63~73行目で線幅変更コンボボックス表示部分のブロックを記述します。このブロックの中には、線幅を変更するコンボボックスを用意します。このサンプルコードでは、1、3、7、13、17、21を設定します。 線幅を変更するコンボボックスが変更された時のイベント(onchange)に、線幅のコンボボックス変更時に呼び出す関数( LineWidthValueChanged )を設定します。 線幅のコンボボックス変更時に呼び出す関数はJavaScriptのサンプルコードの詳細で説明します。
63: <div id="LineWidthBox">
64:     <p>Line Width</p>
65:     <select name="LineWidthPullDown" id="LineWidthPullDown" onchange="LineWidthValueChanged()">
66:         <option value=1>1</option>
67:         <option value=3>3</option>
68:         <option value=7>7</option>
69:         <option value=13>13</option>
70:         <option value=17>17</option>
71:         <option value=21>21</option>
72:     </select>
73: </div>
2.8. 線の色変更のUI
75~78行目で線色変更ボタン表示部分のブロックを記述します。このブロックの中には、線色変更ボタンを用意します。 線色変更ボタンには、カラーピッカーの色が変更された時のイベント(onchange)に、線色変更時に呼び出す関数( LineColorValueChanged )を設定します。 線色変更時に呼び出す関数はJavaScriptのサンプルコードの詳細で説明します。
75: <div id="LineColorBox">
76:     <p>Line Color</p>
77:     <input type="color" id="LineColorPallet" name="LineColorPallet" value="#ffffff" onchange="LineColorValueChanged()">
78: </div>
3. JavaScriptのサンプルコードの詳細
JavaScriptのサンプルコードの詳細を以下で解説します。
3.1. クラスとグローバル変数の説明
3~141行目で線のフォーマットを変更するクラスを定義します。クラス内の各メソッドの詳細は以降で解説します。 また、1行目で線のフォーマットを変更するクラスのグローバル変数を定義します。
var change_Line_Format;

class ChangeLineFormat {

  //中略

}
3.2. コンストラクタ
5~22行目が線のフォーマットを変更するクラスのコンストラクタです。 引数として渡されるブロックのidに対して、mapray.Viewerを作成し、カメラの位置・向きの設定、線の作成、文字の表示の順にメソッド呼び出します。mapray.Viewerのベース地図の画像プロバイダは、画像プロバイダの生成メソッドで取得した画像プロバイダを設定します。 mapray.Viewerの作成の詳細は、ヘルプページ『緯度経度によるカメラ位置の指定』を参照してください。
 5: constructor(container) {
 6:     // Access Tokenを設定
 7:     var accessToken = "<your access token here>";
 8:
 9:     // Viewerを作成する
10:     this.viewer = new mapray.Viewer(
11:         container, {
12:             image_provider: this.createImageProvider(),
13:             dem_provider: new mapray.CloudDemProvider(accessToken)
14:         }
15:     );
16:
17:     this.SetCamera();
18:
19:     this.MakeUIFormatLine();
20:
21:     this.SetLinePointStr();
22: }
3.3. 画像プロバイダの生成
25~28行目が画像プロバイダの生成メソッドです。生成した画像プロバイダを返します。 画像プロバイダの生成の詳細は、ヘルプページ『緯度経度によるカメラ位置の指定』を参照してください。
24: // 画像プロバイダを生成
25: createImageProvider() {
26:     // 国土地理院提供の汎用的な地図タイルを設定
27:     return new mapray.StandardImageProvider( { url: "https://cyberjapandata.gsi.go.jp/xyz/seamlessphoto/", format: "jpg", min_level: 2, max_level: 18 } );
28: }
3.4. カメラの位置・向きの設定
31~56行目がカメラの位置・向きの設定メソッドです。 カメラの位置・向きの設定は、ヘルプページ『緯度経度によるカメラ位置の指定』を参照してください。
31: SetCamera() {
32:     // カメラ位置の設定
33:
34:     // 球面座標系(経度、緯度、高度)で視点を設定。皇居と東京タワーの中間点付近
35:     var home_pos = { longitude: 139.749486, latitude: 35.671190, height: 50 };
36:
37:     // 球面座標から地心直交座標へ変換
38:     var home_view_geoPoint = new mapray.GeoPoint( home_pos.longitude, home_pos.latitude, home_pos.height );
39:     var home_view_to_gocs = home_view_geoPoint.getMlocsToGocsMatrix( mapray.GeoMath.createMatrix() );
40:
41:     // 視線方向を定義
42:     var cam_pos = mapray.GeoMath.createVector3([0, 0, 7500]);
43:     var cam_end_pos = mapray.GeoMath.createVector3([0, 0, 0]);
44:     var cam_up = mapray.GeoMath.createVector3([0, 1, 0]);
45:
46:     // ビュー変換行列を作成
47:     var view_to_home = mapray.GeoMath.createMatrix();
48:     mapray.GeoMath.lookat_matrix(cam_pos, cam_end_pos, cam_up, view_to_home);
49:
50:     // カメラの位置と視線方向からカメラの姿勢を変更
51:     var view_to_gocs = this.viewer.camera.view_to_gocs;
52:     mapray.GeoMath.mul_AA(home_view_to_gocs, view_to_home, view_to_gocs);
53:
54:     // カメラのnear、farの設定
55:     this.viewer.camera.near = 30;
56:     this.viewer.camera.far = 500000;
57: }
3.5. 線の作成
58~86行目が線の作成メソッドです。画面で設定した線幅及び線色で皇居、東京タワー間を結ぶ線を作成、表示します。 線の幅は、74行目で線幅を変更するコンボボックスから値を取得し、それを81行目の線幅を設定する関数(MarkerLineEntityのsetLineWidth)を利用して設定します。 線の色は、75行目でカラーピッカーから値を取得し、78行目でRGB配列を作成した後に、それを82行目の線色を設定する関数(MarkerLineEntityのsetColor)を利用して設定します。カラーピッカーの値からRGB配列を作成するメソッドの詳細は後述します。 線の表示方法の詳細は、ヘルプページ『線の表示(addPointsを使った表示)』を参照してください。
58: MakeUIFormatLine() {
59:     // 直線のエンティティを作成
60:     var entity = new mapray.MarkerLineEntity(this.viewer.scene);
61:
62:     // 皇居の座標を設定
63:     var line_fast_position = { longitude: 139.7528, latitude: 35.685175, height: 350 };
64:
65:     // 東京タワーの座標を設定
66:     var line_second_position = { longitude: 139.745433, latitude: 35.658581, height: 350 };
67:
68:     // 各座標を配列に保存して、直線を追加
69:     var position_array = [line_fast_position.longitude, line_fast_position.latitude, line_fast_position.height,
70:                           line_second_position.longitude, line_second_position.latitude, line_second_position.height];
71:     entity.addPoints(position_array);
72:
73:     // プルダウンの値取得
74:     var line_Width_Value = parseFloat(document.getElementById("LineWidthPullDown").value);
75:     var line_ColorChord = document.getElementById("LineColorPallet").value;
76:
77:     // ColorChordをRBGに変換
78:     var RGBArray = this.convertColorChordToRGB(line_ColorChord);
79:
80:     // プルダウンの値を設定
81:     entity.setLineWidth(line_Width_Value);
82:     entity.setColor(RGBArray);
83:
84:     // エンティティをシーンに追加
85:     this.viewer.scene.addEntity(entity);
86: }
3.6. 文字の表示
88~108行目が文字の表示メソッドです。皇居と東京タワーの文字を表示します。 文字の表示方法の詳細は、ヘルプページ『文字の表示(addTextを使った表示)』のヘルプページを参照してください。
 88: SetLinePointStr() {
 89:     // 文字のエンティティを作成
 90:     var entity = new mapray.TextEntity(this.viewer.scene);
 91:
 92:     // 皇居より400mほど東の場所を設定
 93:     var fast_font_position = { longitude: 139.758503, latitude: 35.685030, height: 350 };
 94:
 95:     // GeoPointクラスを生成して、テキストを追加
 96:     var fast_font_geopoint = new mapray.GeoPoint(fast_font_position.longitude, fast_font_position.latitude, fast_font_position.height);
 97:     entity.addText( "The Imperial Palace", fast_font_geopoint, { color: [1, 1, 0], font_size: 25 } );
 98:
 99:     // 東京タワーより300mほど東の場所を設定
100:     var second_font_position = { longitude: 139.749169, latitude: 35.658252, height: 350 };
101:
102:     // GeoPointクラスを生成して、テキストを追加
103:     var second_font_geopoint = new mapray.GeoPoint(second_font_position.longitude, second_font_position.latitude, second_font_position.height);
104:     entity.addText( "Tokyo Tower", second_font_geopoint, { color: [1, 1, 0], font_size: 25 } );
105:
106:     // エンティティをシーンに追加
107:     this.viewer.scene.addEntity(entity);
108: }
3.7. 線の幅変更
110~117行目が線幅変更メソッドです。112行目で線幅を変更するコンボボックスから値を取得します。そして、115行目のviewer.sceneのgetEntity関数で表示している線のエンティティを取得し、116行目で取得した値を指定することで、線の幅を変更します。このサンプルコードでは、線のエンティティのインデックスは0となるため、getEntity関数には0を指定します。
110: ChangeLineWidth() {
111:     // プルダウンの値取得
112:     var line_Width_Value = parseFloat(document.getElementById("LineWidthPullDown").value);
113:
114:     // プルダウンの値を設定
115:     var lineEntity = this.viewer.scene.getEntity(0);
116:     lineEntity.setLineWidth(line_Width_Value);
117: }
3.8. 線の色変更
119~129行目が線色変更メソッドです。121行目でカラーピッカーから値を取得し、124行目でカラーピッカーの値をRGBの配列に変換します。そして、127行目のviewer.sceneのgetEntity関数で表示している線のエンティティを取得し、128行目でその値を指定することで、線の色を変更します。このサンプルコードでは、線のエンティティのインデックスは0となるため、getEntity関数には0を指定します。
119: ChangeLineColor() {
120:     // プルダウンの値取得
121:     var line_ColorChord = document.getElementById("LineColorPallet").value;
122:
123:     // ColorChordをRBGに変換
124:     var RGBArray = this.convertColorChordToRGB(line_ColorChord);
125:
126:     // プルダウンの値を設定
127:     var lineEntity = this.viewer.scene.getEntity(0);
128:     lineEntity.setColor(RGBArray);
129: }
3.9. 色情報の変換
131~139行目が色情報の変換メソッドです。 色情報の変換方法の詳細は、ヘルプページ『文字のフォーマットの変更』を参照してください。
131: convertColorChordToRGB(colorChord) {
132:     var colorChordChars = colorChord.split('');
133:
134:     var r = parseInt(colorChordChars[1].toString() + colorChordChars[2].toString(), 16) / 255;
135:     var g = parseInt(colorChordChars[3].toString() + colorChordChars[4].toString(), 16) / 255;
136:     var b = parseInt(colorChordChars[5].toString() + colorChordChars[6].toString(), 16) / 255;
137:
138:     return [r, g, b];
139: }
3.10. 線のフォーマット変更クラスのインスタンス生成
143~145行目の関数は、引数として渡されるブロックのidを利用して、線フォーマット変更クラスのインスタンスを生成します。
143: function CreateChangeLineFormatInstance(container) {
144:     change_Line_Format = new ChangeLineFormat(container);
145: }
3.11. 線幅変更時のイベント
147~149行目の関数は、線幅変更時に呼ばれ、線フォーマット変更クラスの線幅変更メソッドを呼び出します。
147: function LineWidthValueChanged() {
148:     change_Line_Format.ChangeLineWidth();
149: }
3.12. 線色変更時のイベント
151~153行目の関数は、線色変更時に呼ばれ、線フォーマット変更クラスの線色変更メソッドを呼び出します。
151: function LineColorValueChanged() {
152:     change_Line_Format.ChangeLineColor();
153: }
4. 出力イメージ
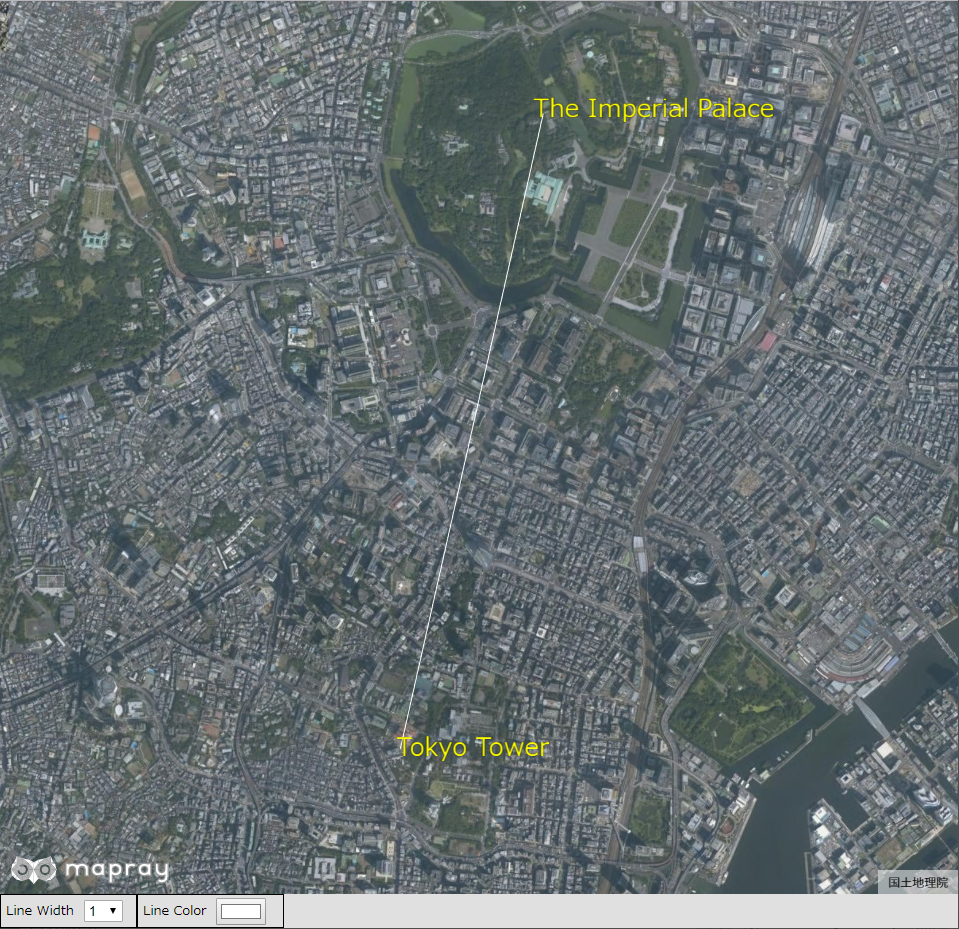
このサンプルコードで初期状態(線幅:1、線色:白)の出力イメージは下図のようになります。
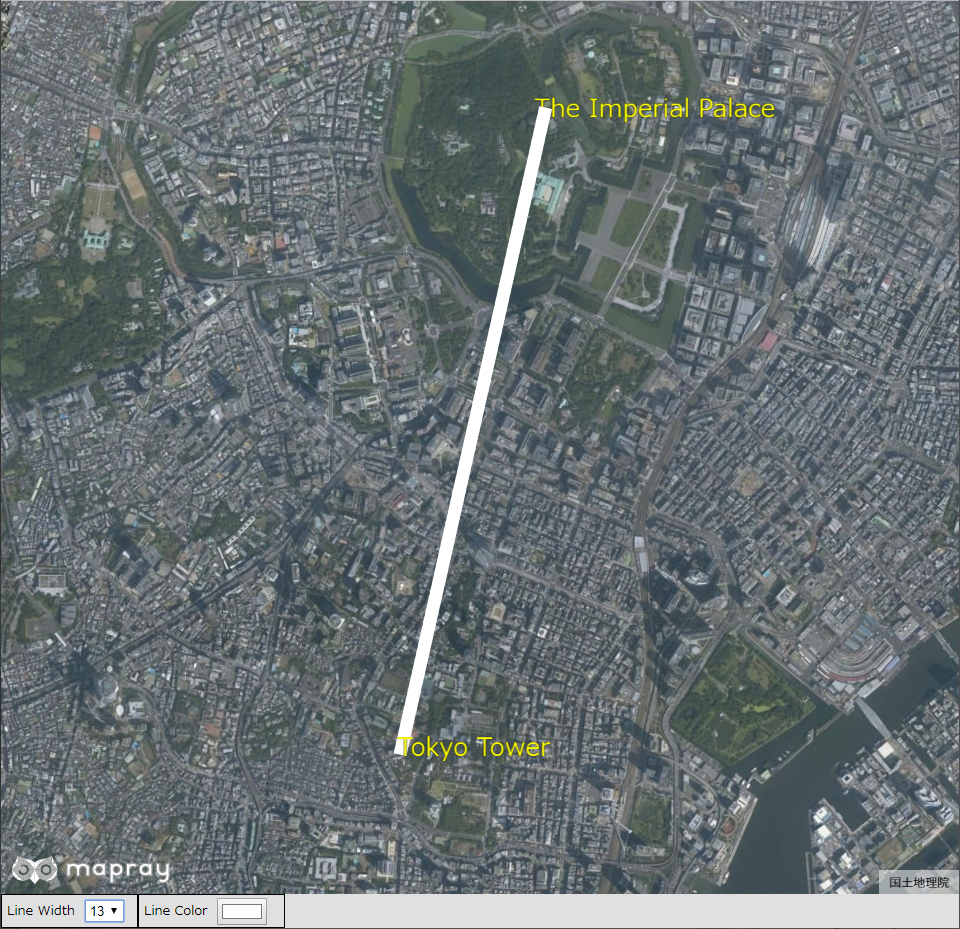
初期状態から、線幅を13にした時の出力イメージは下図のようになります。
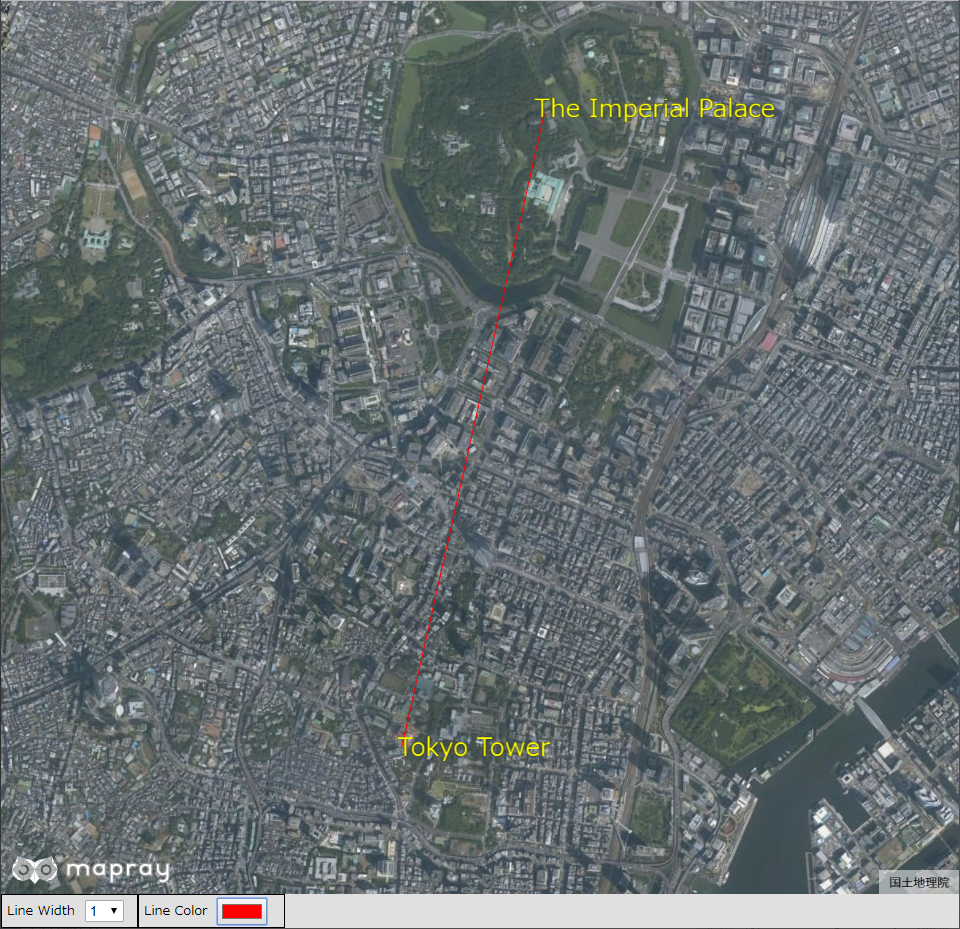
初期状態から、線色を赤にした時の出力イメージは下図のようになります。